The green tick in the image below shows the correct answer to a quiz question I posted very many moons ago about how the current through Port Phillip Heads changes with time over about an hour or so on either side of the predicted slack water time. That "forum quiz" was to gain an insight into how recreational boaters thought slack water "worked". Pleasingly a few sea-breeze sailors did pick the correct answer (sketch #4). Congratulations to: Guitz, wongaga, tarquin1, and Bananabender.
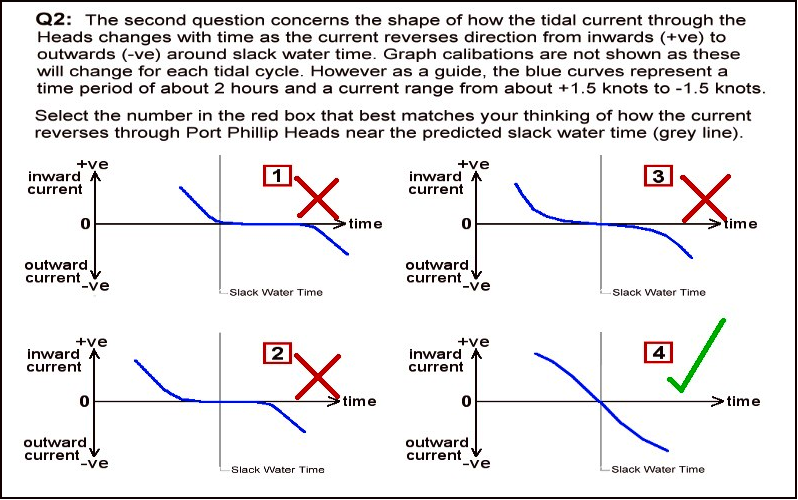
Unfortunately sketch #3 was chosen by most others. A similar result came from an expanded quiz circulated later. It targeted various yacht clubs, boat ramps, scuba diving clubs, and fishing clubs where members frequent the Port Phillip Heads area. Congratulations to sailor Tom from QCYC, and scuba diver Walter from VSAG for selecting sketch #4. Overall this survey was disappointing in respect of the high percentage ( > 85% ) of incorrect answers (mostly sketch #3).
In the final days of the expanded quiz I took a ferry ride across to Queenscliff, the closest "boating town" to Port Phillip Heads. I trudged around the large marine precinct bailing up folks with a copy of that quiz question. Those approached included professional fishermen, amateur fishermen, scuba divers, and a boat-based Heads surfboard rider. Most were claiming 150+ visits to Port Phillip Heads, yet none selected the correct answer. Most chose sketch #3 instead.
Later I spotted a Pilot Launch returning to its berth. It had serviced an inbound ship, so the Pilot had already transferred off to guide that ship in through the entrance and up to Melbourne. Undeterred I presented the quiz question to the coxswain. He started out pointing a finger at sketch #3 but then said "no wait", and moved it to sketch #4. Hooray one correct response for the day!
Heading back to the ferry at sunset I saw another Pilot Vessel pull into its dock. It disembarked a group of men, one of whom was a Pilot standing down from having guided a ship down from Melbourne and out through the Heads. He scanned the four sketches for just a handful of seconds then confidently tapped sketch #4 and said "that's the one". It made me feel a lot better knowing that commercial ships transiting Port Phillip Heads are in good hands. I hope all vessel skippers and crew in the recreational sector will eventually climb aboard.
To be sure the point is made, I have plotted some official Port Phillip Heads current prediction data from 2020. Note this data comes from an algorithm that has been well verified by many direct measurements. It is also backed up by all hydrodynamic models and the fundamental laws of physics.
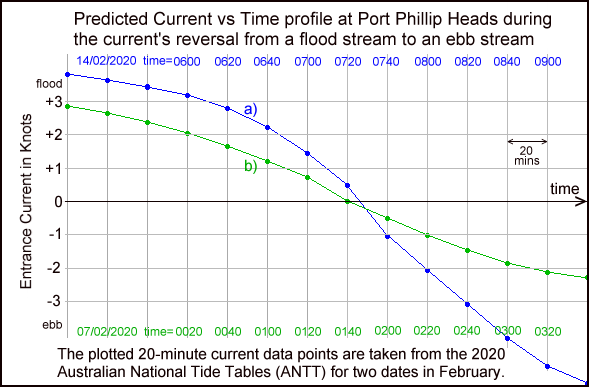
The curves show the predicted current versus time plots for Port Phillip Heads around slack water time. Blue plot "a)" is for a typical current reversal at the end of a spring flood tide. Green plot "b)" is for a reversal after a neap flood tide. On the central Victorian coast the maximum spring tide effects occur 4 - 5 days after a New or Full Moon. The weakest neaps occur 2 - 3 days before a New or Full Moon.
Both the above curves show a current vs time plot that has the same general shape as quiz sketch #4. The most rapid change in current speed occurs around slack water time, which may surprise many. This is in stark contrast to sketch #3 which has its slowest change in current speed occurring around slack water time. (Note the data only covers a window of around 2 hours on either side of slack water and so does not show the maximum flood and ebb currents.)
Tide stream reversals after an ebbing tide will of course have rising current plots (positive slopes) as the -ve ebb current reverses into a +ve flood current. Again rather than any "flatfish spots" near slack water, such curves have their steepest slopes around slack water time. Again this is the exact opposite to the commonly assumed "flat spot myth" shown in sketch #3.
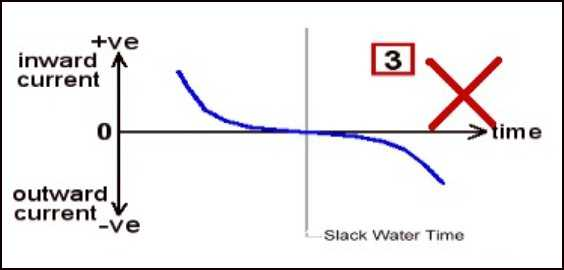
Why are many/most recreational boaters not really across how the current reverses at Port Phillip Heads? There seems to be two possible explanations. Firstly, it is possible some folk misinterpreted the quiz question as:- How does the "force" of the current change over time around slack water, rather than its "speed".
Now the force of a current, as felt by the pull on an anchor line, rises roughly as the square of its speed. This means a correct speed curve like sketch #4 would have a corresponding force curve somewhat similar in shape to sketch #3.
The more likely second explanation is simple but rather startling. Factual errors in the "official advice" on tidal streams at the Heads provided by Ports Victoria are actually leading boaters to assume sketch #3 (with its "flat spot") is the true behaviour!
Unfortunately this outcome is both unhelpful and potentially dangerous to those targeting slack water to pass through Port Phillip Heads, or those just futzing around there like fishers, scuba divers and the boat-based surfers who ride the Pt Nepean break at slack water. This myth promotes the notion that the rate at which the current changes its speed over time is lowest around slack water, when in fact the opposite is true with the most rapid changes in speed occurring around slack water time.
The root cause of the problem is that the port authority's information on tidal streams at Port Phillip Heads is based on an inappropriate "mass-less" view of water flow through the Heads. They claim that water flows IN when the "outside" level is higher than the "inside" level, and OUT when the "outside" level is lower than the "inside" level. It therefore claims that the "Equal Levels" moment and the "Slack Water" moment occur together at the very same time. This is a very widely held belief.
Unfortunately this line of thinking ignores the water's mass and so discards any consideration of its momentum. This is a crucial weakness for large systems like Port Phillip where very large water masses are in motion and at considerable speeds. In these systems the water momentum effect is simply too large for the weakening frictional forces to stop the flow by the time the "Equal Levels" point is reached.
Under the false "Equal Levels and Slack Water Happen Together" advice for PPH, many recreational boaters assume that if there is virtually no level difference at slack water, only weak or no forces are acting on the water at that time. They then go on to assume that if this weak force period exists, the water's speed can't be changing quickly around slack water. This is of course incorrect and exactly opposite to the real behaviour where the most rapid changes in current speed occur then.
Unfortunately that same incorrect advice is repeated on the BoM website, and in several tidal publications from the Australian Hydrographic Office. From these official sources it has quickly extended out to infect all manner of web and other types of publications. I have tackled both the federal bodies on this issue but they will not act because they see it as a "state waters" matter, figuring that the VIC authorities are best placed to advise on what goes on at Port Phillip Heads.
I first raised this issue with PoMC (back in the day). It took their "tides officer" less than 24 hours to conclude that yes there was a problem and perhaps their advice needed amendment. It took a bit longer for the then Harbour Master (HM) to agree that "there is merit in adjusting the wording". Unfortunately all this occurred around the time the Port of Melbourne's operations were effectively being part-privatised, with staff concerned about their own futures under the new arrangements. Consequently it was a low-priority issue and no adjustments of the "official line" were actually made.
The much smaller "retained government part" became VPCM, which still held responsibility for navigation and safety. A sequence of HMs then followed, and in more recent times VPCM was amalgamated with the Geelong based VRCA to become a new state wide body "Ports Victoria". Throughout this period I put a series of submissions to the passing parade of HMs. Some were ignored and some were sent to an external consultant for review. His verdict was that while all the claims I was making were true, he recommended sticking with the existing official line for "simplicity's sake". All involved seemed to entirely miss the point that "being simple" was a leading cause of boaters drawing the wrong conclusion about how the speed of the current changes over time as a tidal stream reverses.
At first sight the "official line" may sound reasonable enough and is probably close to the truth for small bays and estuaries where flow volumes are much smaller. However due to its sheer size, Port Phillip's inflows and outflows are both fast and massive. Peak water speeds may be over 10 kph with water flows of up to 80,000 tonnes per SECOND through the Heads! To put things in perspective for the many Sydney based readers of the original "quiz post", the volume of water departing Port Phillip during a strong ebb stream is the rough equivalent of draining Sydney Harbour completely dry, two or three times over.
The amount of forward momentum injected into the Bay waters during a strong flood tide is simply ENORMOUS, making its tidal streams "unstoppable" by frictional forces alone. Typically by the time the falling "outside" and rising "inside" levels become equal to each other, a tidal stream still has one or two knots of speed left in it. Consequently, and due to the large residual momentum still possessed by this enormous mass of slowly moving water, the flow continues on in the same direction well beyond the "Equal Levels" time.
The continuing flow is not only slowed by the usual (but decreasing) frictional forces, but now also by an increasingly "up-hill" slope as the two water levels continue moving apart. In the flood stream case, the falling "outside" level is dropping further and further below the still rising "inside" level. This produces a growing "reverse level difference" force. At first this just assists the frictional slowing of the current, but it slowly grows to become the dominant slowing force as the system approaches the slack water moment.
This is why the previous blue current graph "a)" shows its slope, or "slowing rate", actually becomes more severe the closer we get to slack water. This is in stark contrast to the popular sketch #3 where the "slowing rate" becomes much less severe as slack water is approached. That graph also shows the steepening slope begins roughly 40 to 50 minutes before the zero current or "slack water" point. This suggests the duration of the up-slope flow phase is around a similar number of minutes.
The growing reverse level difference is mostly due to "outside" level changes, with a smaller contribution from the opposite movement of the "inside" level. The tide height predictions allow us to estimate that for spring tides the level difference must grow at a rate of roughly 40 cm/hr near slack water time. Continuing this rate for 40 to 50 minutes from the equal levels point implies the reverse level difference grows to roughly 27 to 33 cm by the time it has stopped the flow to produce slack water. Data from the tide gauge network confirm this degree of reverse level difference is commonly observed as a strong spring tide stream comes to a stop.
There is quite a difference in behaviour between the "bad advice" and the "good advice" around slack water for those who target this time to make their activities safer at Port Phillip Heads. This also applies to Bay waters within about 10km of the Heads. From a safety point of view, it is both safer and also useful for skippers to know that the rate at which the tidal current changes speed around slack water is roughly constant for each particular slack water event. However these rates of speed change (or "reversal rates") can differ from one slack water to the next due to variations in the sequence of tidal cycles. The reversal rates range from as low as 0.15 knots per 10 minutes to as high as 0.7 knots per 10 minutes.
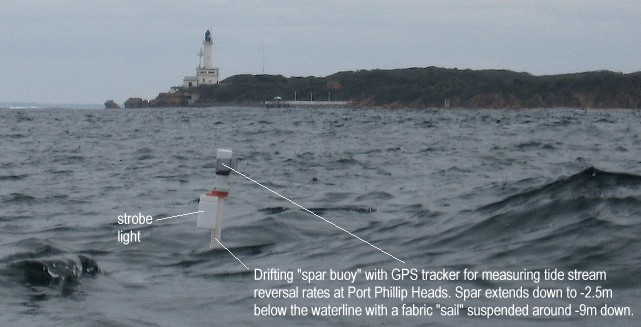
The image below shows the free-drifting "spar buoy" equipment that can measure reversal rates at slack water. The relationship of water slope to the slack water reversing rate is explained in this link.
This range of possible reversal rates makes it clear that the very common question about Port Phillip Heads: "How long does slack water last?" does not have a simple answer. The reality is we only have a "Slack Water Window", within which the current levels are low enough not to endanger a particular activity at the Heads. Furthermore, not only will the duration of this "safe window" depend on the particular reversal rate for that slack, but also on the "safe current" limits chosen to define the width of that window. These will depend on the capabilities of the vessels or individuals involved in undertaking whatever recreational activity is being considered.
Nevertheless, the common answer of "slack lasts about 30 minutes" is a reasonable starting point, but depending on all the particulars, it could be half that number, or double it!
Moving inwards from the Heads the Bay widens out a lot, but also becomes much shallower across an area called "The Great Sands". Although at this point the Bay is ten times wider than at the Heads, the underwater cross-section is only about four times larger. Consequently over that distance both the maximum current strength and the reversal rates drop to about a quarter of those at the Heads.
Northward of "The Great Sands" the water quickly deepens to around 20 m. This bumps the Bay's underwater cross-section up another 4 or 5 times. The maximum current levels and the reversal rates then drop down to insignificant numbers ( 0.1 to 0.3 knots) and hardly affect any type of recreational activity for the remainder of the way north to Melbourne. Often the weak tidal streams there get masked by wind driven water circulations. The situation is not quite so benign on the western side of the Bay where the "tidal breathing" of the long and relatively narrow western arm of the Bay does raise current levels a little higher.
With a total of around 26 billion tonnes of water in the Bay, even low speeds are associated with significant water momentum effects.
I have used data from a low resolution hydrodynamic model of Port Phillip to create the animation below to help visualise both the sea level and tidal current behaviour. It may help to understand the large inertia and momentum effects on the current's behaviour, and the relationship of both the sea level differences and the currents to the "Equal Levels" and "Slack Water" moments.
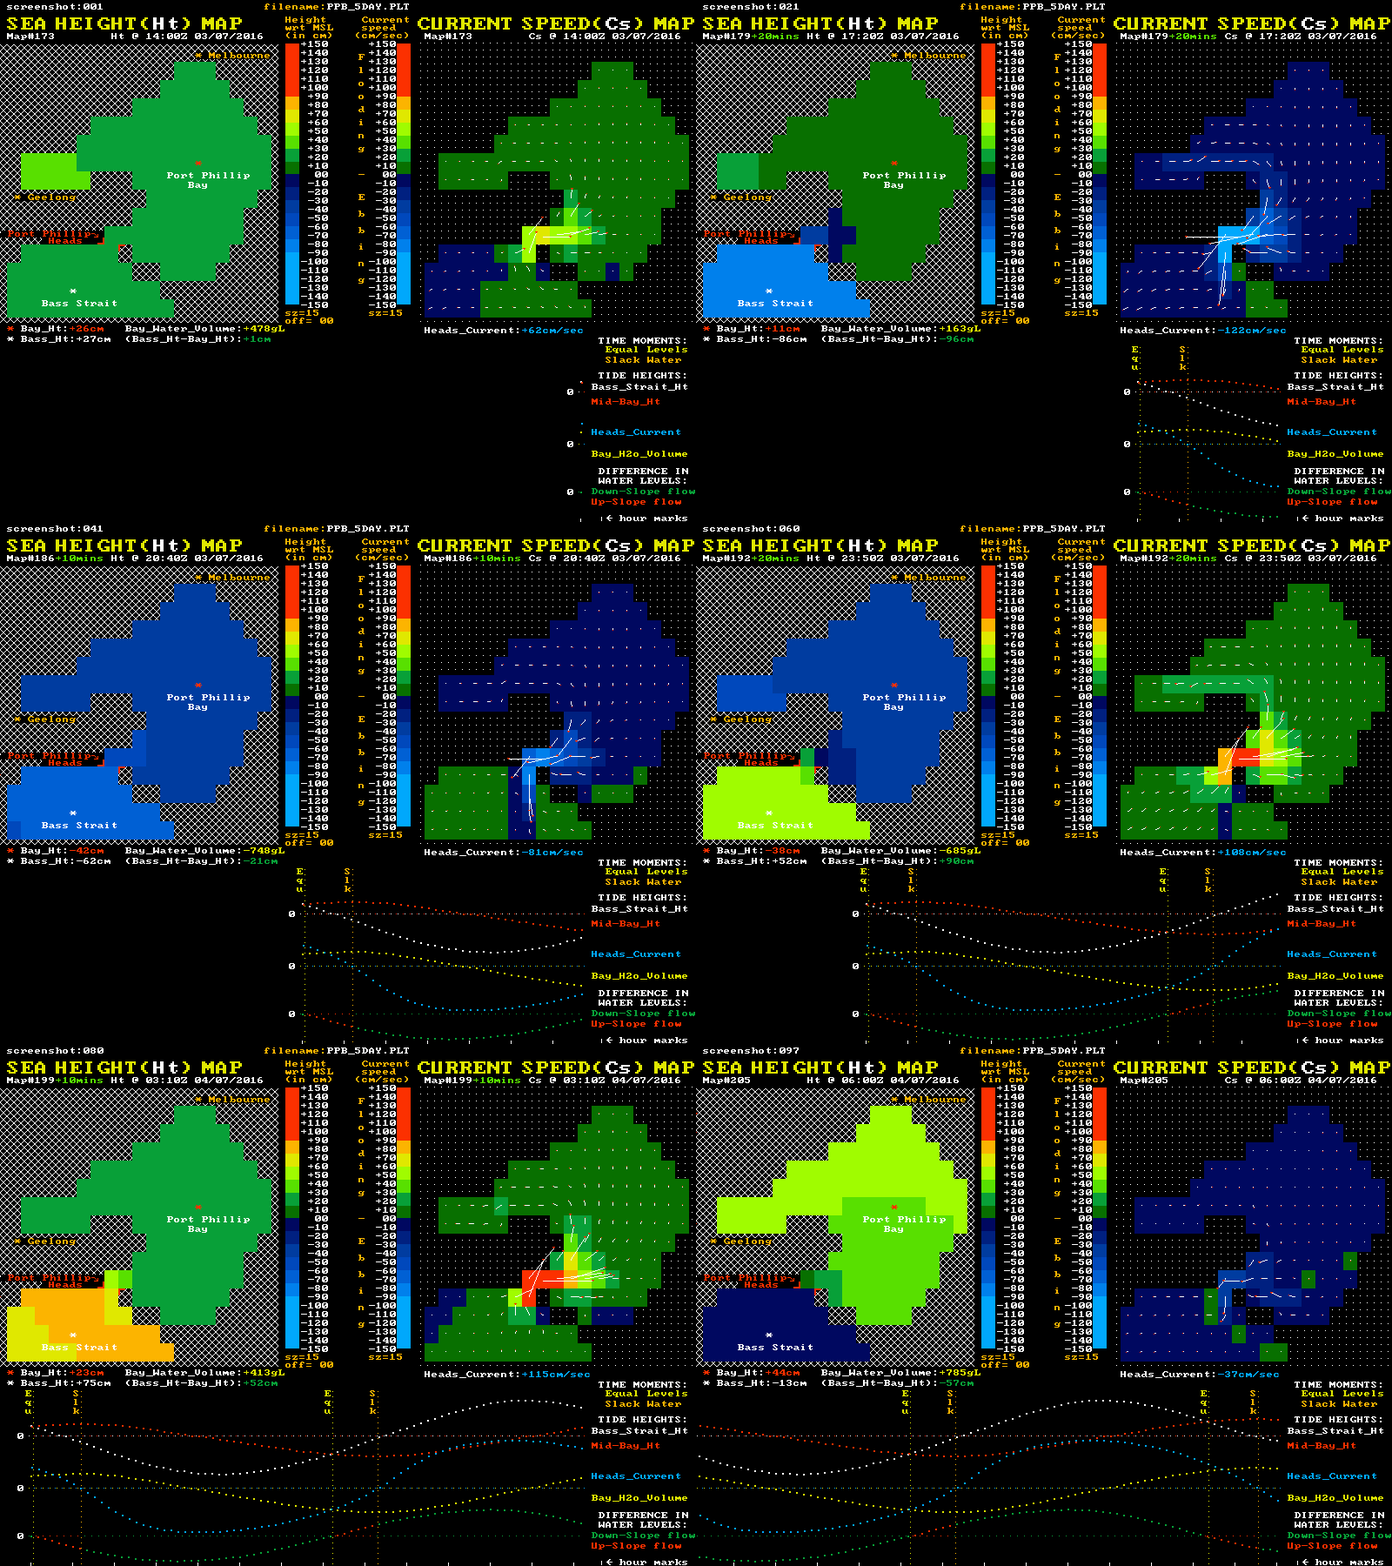
Twin "maps" of Port Phillip are shown, with colour coded sea level heights on the left map and colour coded current speeds and direction on the right map. The lower section shows graphical plots of the "outside" (white) and "inside" (red) sea level heights. Each height is taken as the average value of a cluster of cells around the white and red locations mark with a *. The lowest plot is of the level difference (Bass_Ht - Bay_Ht). This shows as green during down-slope current flow and as red for the up-slope phase.
It is this level difference that drives the Bay's currents and tides. When one side is higher than the other, water pressure differences create a horizontal force that acts on the enormous water mass between the ocean and mid-bay regions. However this force, modified by the frictional resistance, only determines the rate of change in the water's speed and does not in itself directly determine the resulting speed, or indeed the direction of the water flow. ( Acelebration = Force / mass )
The level difference is a measure of the strength of the applied "driving" force. Forget the Moon & Sun, they serve only to wobble the "outside" ocean level up and down, and have no direct gravitational effect on water bodies the size of Port Phillip. Tidal streams at the entrance, and tides within Port Phillip Bay, are all the result of these level difference forces pushing a large mass of water back and forth while also overcoming various frictional resistances. These inflows and outflows alter the volume of water residing in the Bay and hence make its internal tide heights rise and fall.
The animation's blue plot shows the resulting current velocity through the Heads. Positive values indicate a flooding (inward) current. Note that the slope of this blue curve is at its steepest as it passes through the slack water times, in accord with the "winning" sketch #4. The yellow plot shows the variation over time of the volume of water residing within the Bay relative to its volume at Mean Sea Level (MSL). Naturally it's minimums and maximums correspond to the slack water times. The changing numerical values of each plot point are shown as coloured numbers below the maps.
This fairly low resolution model exaggerates the up-slope phase slightly because its in/out mass flows are a little larger than in the real life Bay. This is due to the entrance being modelled by a slightly too wide single cell. In the real Bay, the up-slope flow times are more typically observed to be in the 35 to 80 minute range. All the main features of the Bay's water flow are reasonably represented here, but the data shown is just a small subset extracted from a much larger scale "all of Bass Strait" hydrodynamic model produced by the Tasmanian tidal modelling company "TideTech". The much newer CSIRO national tidal model does have better spacial resolution, but its complex unstructured pattern of cells puts animation of its data way beyond my programming skills.
The animation may be too fast to follow the level changes effectively, so there are some alternatives:-
a) There are larger scale static graphs at these links:- Flood -> Slack and Ebb -> Slack
b) There is a static image of a sequence of eleven commented screenshots at this link: See 11 frame sequence. This may render as a tall and skinny image, in which case the image will need to be "clicked" to bring it up to full width. The commented frames can then be scrolled through one at a time at your own pace.
c) There is a slower version of the animation available at this link: Slower PPB Animation
The animation shown above had its colour banding for sea height set at 15 cm per band so the whole cycle could be accommodated in the limited colour pallette available. The two static images below are of "slack after flood" and "slack after ebb" respectively, but with a finer colour banding set at just 5 cm per band. This better demonstrates the physical extent of the reverse slope regions at slack water time.
"Slack after FLOOD"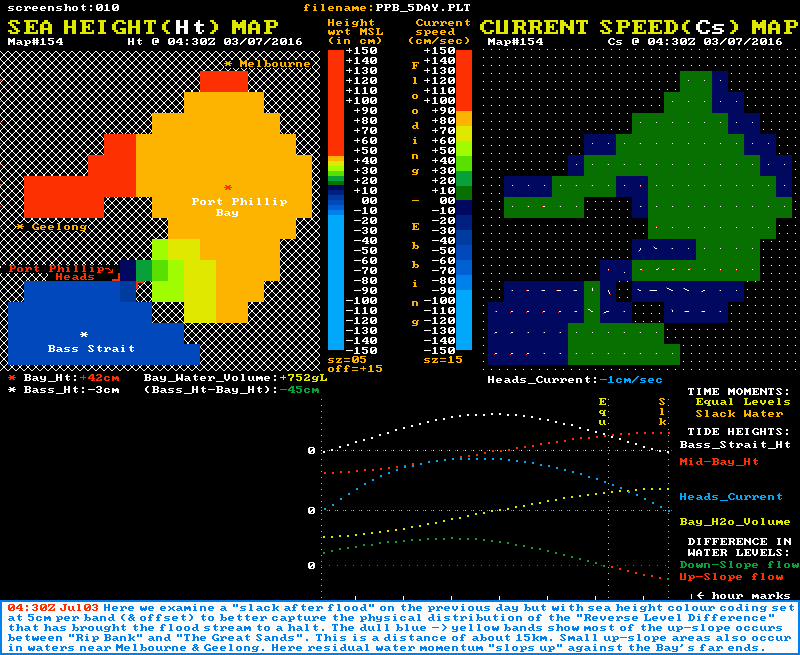
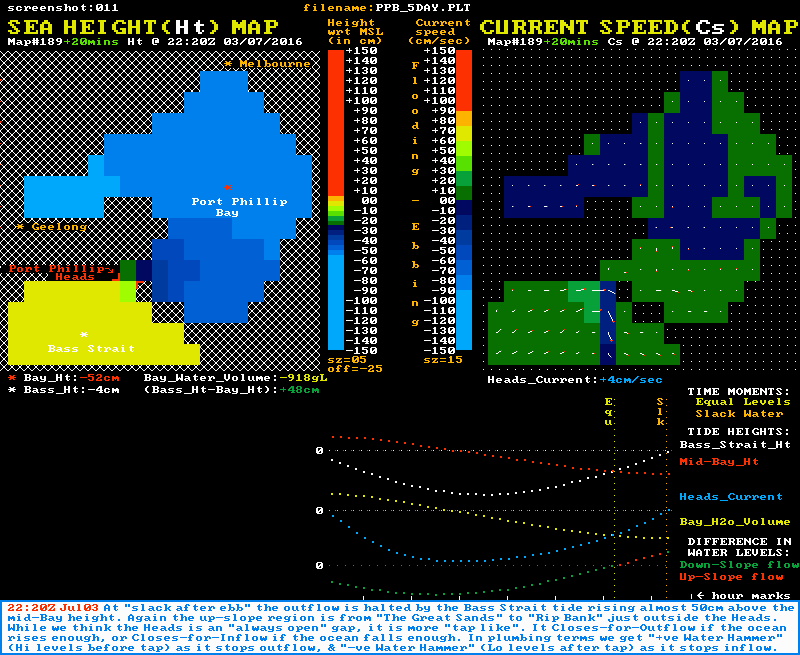
Note also that the graph section of both images shows that at the "Equal Levels" moment (yellow time line), the Heads current is still flowing with some strength. It is the residual momentum in the tidal stream at this time that powers the up-slope flow phase until slack water is reached (orange time line). Again note the speed of the current changes most rapidly around the slack water times.
In both types of slack water the reverse slope region extends over about 15 km from just outside the Heads at "Rip Bank" to the northeastern edge of "The Great Sands" area. The map below outlines in yellow the so called "choke zone" which is responsible for most of the limiting of the Bay's inflows and outflows. The flow restriction is caused by both the narrow sections near the entrance and the vast shallows (lighter blues) of "The Great Sands".
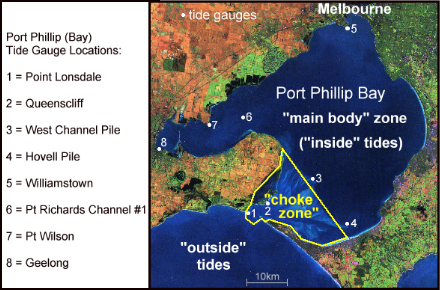
When the Heads currents are fast (4-6 knots) and producing very strong turbulence through the Heads, about 2/3rds of the forward driving level difference occurs between points 1 & 2, with the rest spread over the distance between point 2 and points 3 & 4.
At the "Equal Levels" time when the Heads current has slowed to between 1 to 2 knots there is essentially no level difference across the "choke zone". Its waters are then "un-driven" and so are just "coasting along". This tidal stream overcomes the frictional flow resistance at this lower speed by "using up" some of the water's forward momentum and slowly shedding speed.
When the level difference has reversed and grown big enough to completely stop the flow (typically 20-30 cm), this gives us "slack water". We then find that about 2/3rds of that reverse level difference occurs between point 2 and points 3 & 4, with only 1/3rd or less occurring near the Heads. In short: When the current is running hard it is the small "Rip" and Heads area that dominates proceedings. As the water rapidly slows approaching slack water, the extensive "Great Sands" area becomes the dominant player.
During the enhanced slowing period, the flow is running "up-slope" and is entirely momentum driven, as distinct from the usual "down-slope" (gravity driven) flow that dominates during the majority of the tidal stream's run. Technically all bay and estuary entrances must exhibit this behaviour to some extent, but for most locations the smaller moving water mass involved means the "up-slope" flow phase is often too small to be noticed.
However as we move to water bodies of larger size, the mass of the moving water involved tends to grow more quickly than the friction levels that oppose those water movements. In the case of the very large Port Phillip, tidal streams are in the "up-slope" phase for around 15% to 25% of their total flow time, so the effects are certainly observable.
Similar effects occur in Bass Strait itself, where significant water flows occur between the major headlands and the major islands of the Strait. It is particularly strong in Banks Strait where water flows through a 20 km wide gap between the northeast tip of Tasmania and the southernmost islands of the Furneaux group. A location map for Banks Strait is shown below.
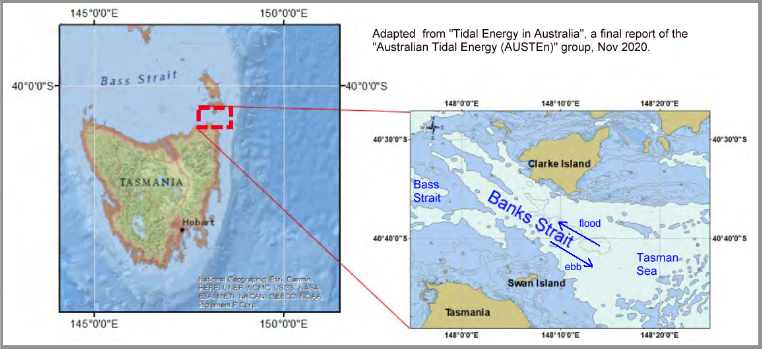
Although the maximum currents here are lower than at Port Phillip Heads, the width and depth of Banks Strait means the mass flows are far higher. This gives higher levels of water momentum that need to be dissipated to finally stop a tidal stream. The up-slope flow phase of tidal streams in Banks Strait lasts for around 2 hours, or 30% or so of their total flow time. At slack water a reverse level difference of around 70 cm exists between Tasman Sea waters at one end of the strait and the Bass Strait waters at the other. A "Sea Height & Current Speed" animation of Banks Strait is shown below:
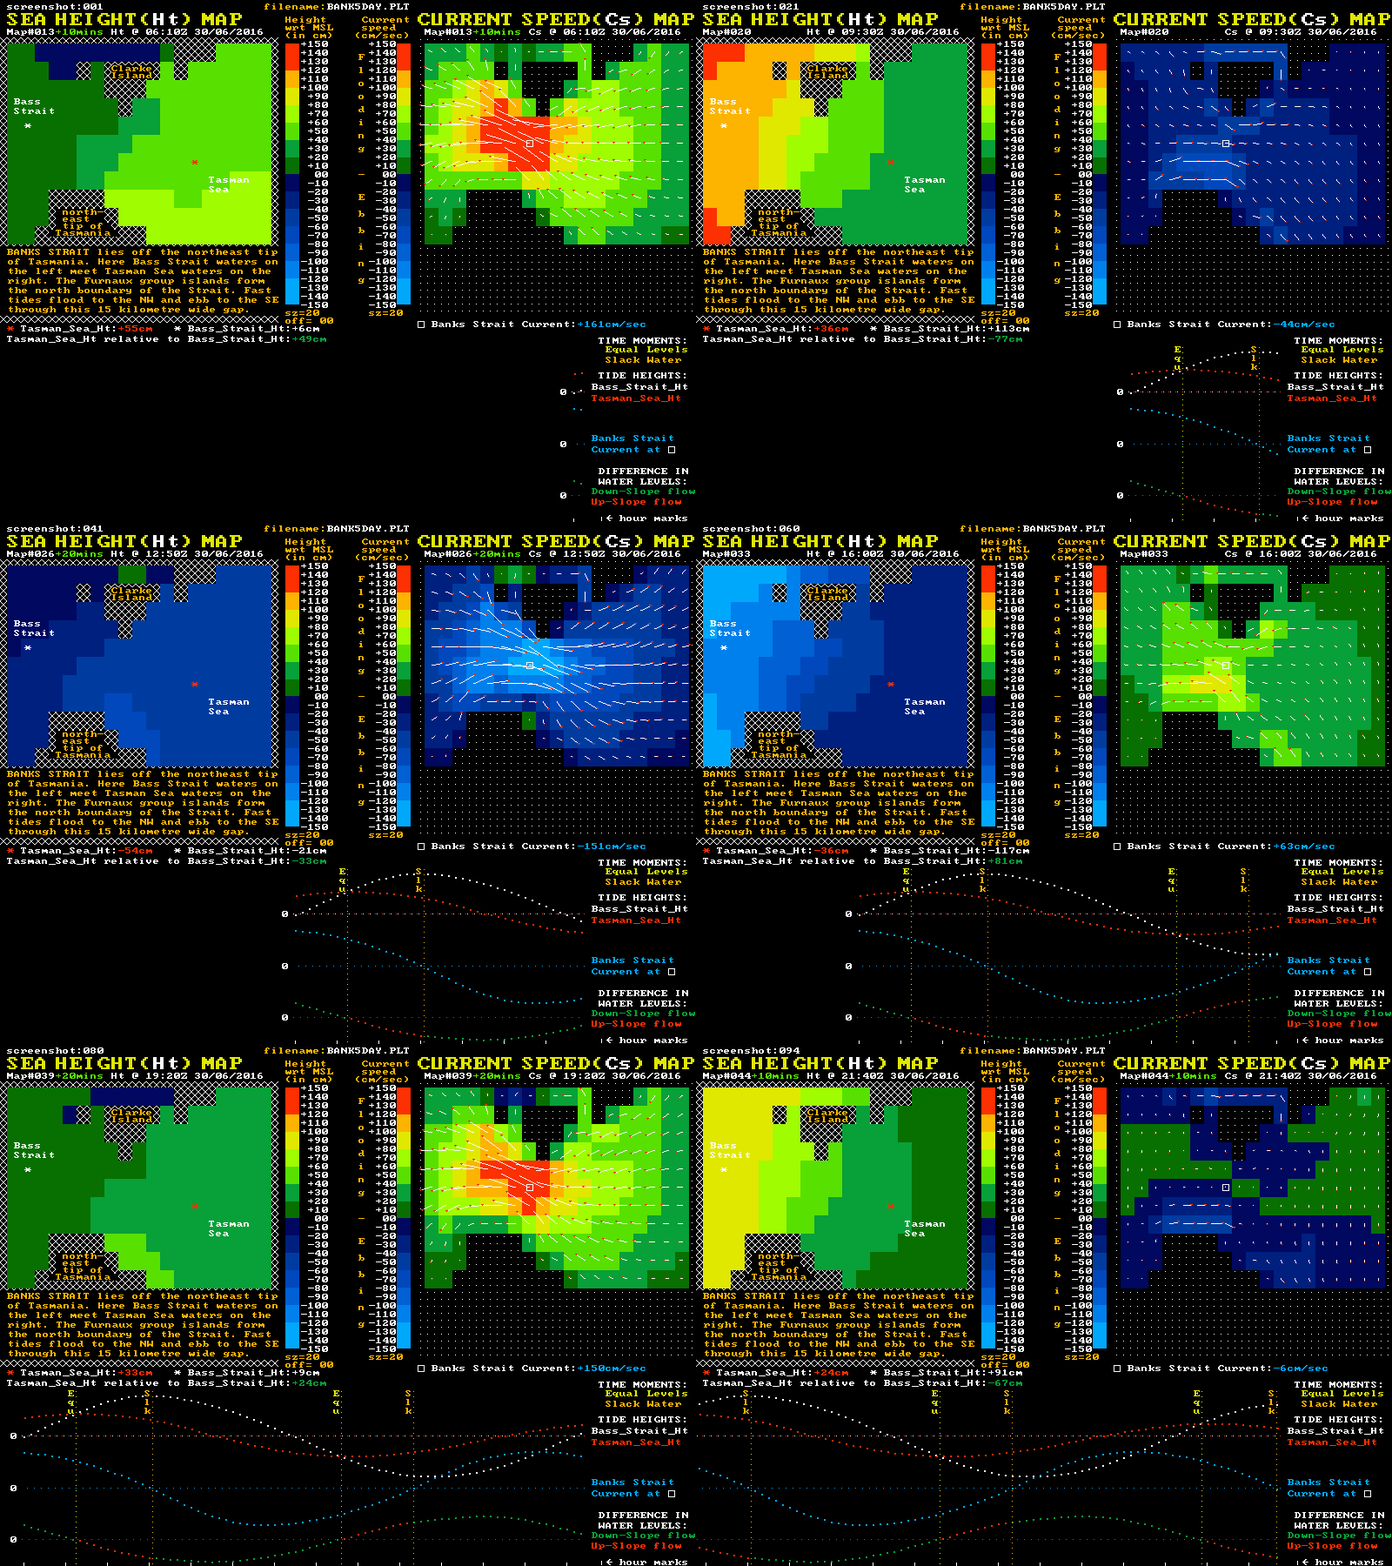
Of note in this waterway is that the tidal current speed at the "Equal Levels" time is still more than 50% of the maximum speed. Also of note is that the shape of the blue current plot is again in accord with the "sketch #4" style with its steepest slopes occurring near slack water.
There is a larger scale static graph at this link:- Banks-Strait-Plots
Another example (but with no map or animation) is King Sound on the Kimberley Coast in Western Australia. This is a large gulf around 100 km long by 50 km wide, with a very large tidal range. The up-slope flow times are again around 2 hours, with the reverse level difference from one end of the sound to the other growing to around 200 cm by slack water time.
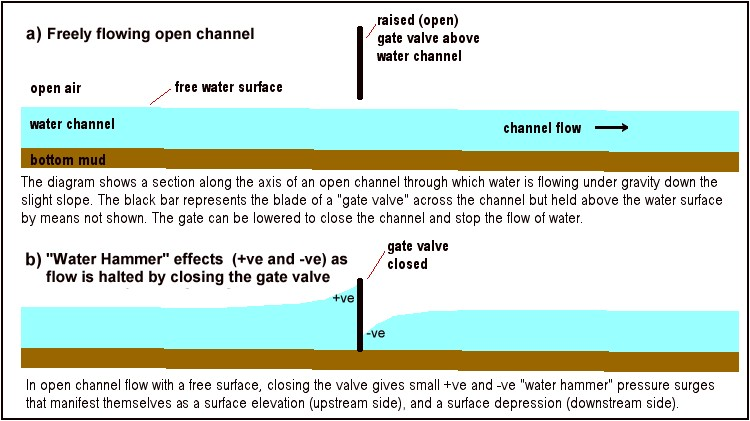
Plumbers who work on older houses with rigid metal water pipes will be very familiar with the "Water Hammer" effect. It occurs when a tap at the end of a long run of water pipe is suddenly closed to shut off the flow. The momentum of the moving water in the pipe means it tries to keep moving forward but in doing so it squeezes the water just ahead of the tap. This creates a very high pressure pulse there, usually producing a loud "bang". Often this sounds like the pipe has been struck by a hammer.
If instead of an enclosed pipe we have an open water channel with some sort of a valve at the far end, then "Water Hammer" still occurs. However the response is more muted because the water isn't confined on all sides and can rise up in height just ahead of the valve in response to the pressure surge. This softens the "hammer blow" to more of an "upward slosh". The size of this level rise is determined by: i) the mass of water in the channel, ii) its initial speed, and iii) the rate at which the valve is closing.
We really need to label the above effect as "Positive Water Hammer" because the water pressure and height both INCREASE just ahead of the closing valve at the downstream end of the water channel. If instead the valve is located at the upstream end of the channel, then we get "Negative Water Hammer", with a DECREASE in both the water height and the water pressure just downstream of the closing valve.
In negative water hammer, the momentum of the water in the channel tries to keep it flowing away from the valve, while at the same time the closing valve is reducing the amount of water able to flow through it. This flow imbalance depletes water just downstream of the valve and so its level falls. This diagram shows a long channel with a mid-point valve. It shows both types of the water hammer effect.
While the 3 km wide gap at Port Phillip Heads may appear as "always open" to water flow, in fact at certain times it acts just like a closing valve. This produces some large scale water hammer effects, but in a relatively "slow motion" manner.
In the last half of an ebbing (or outflowing) tide, this "Heads Valve" is in fact being slowly closed for outflow because the ocean level is then rising. This progressively reduces the height drop from the mid-Bay level down to the ocean's level and so progressively reduces the outflow rate through the Heads.
Here we have a "Positive Water Hammer" situation where the momentum of the southbound water within the Bay delivers water into the area inside the Heads at a faster rate than the closing "Heads Valve" allows it to exit the Bay. The water level in this area therefore rises, despite the fact that the current is still flowing outwards through the Heads.
By the time a previously strong outflow is actually halted to give "slack water", the water level at the Heads is typically some 30 cm ABOVE that in the middle of the Bay - all thanks to the "Positive Water Hammer" effect.
The fact that the tide height can be rising in this area while the water is still pouring out through the Heads may seem confusing, but not when you consider the most generalised rule of tides: "The tide height at any location will rise if water is delivered into that area at a faster rate than it is being removed from the area".
This rule is how you make sense of the relationship between movements in tidal heights and tidal currents in the southern part of Port Phillip where the tidal currents are largely back and forth along the shoreline, rather than flowing perpendicular to it as in the northern areas. Tide heights in these strong current areas can change from rising to falling, or vice versa, without requiring any change in the direction of the tidal current.
The High and Low Tide time delays for locations between the Heads and the central Bay simply identify for each tidal cycle those two times when the volume flow rates towards and away from that particular location are exactly equal. This gives a brief period of time with no net change in the amount of water surrounding that location and hence no change in its level.
A situation: Consider the case of a kayak operating in calm weather just inside the Heads and near the Point Lonsdale beach. The paddler may decide to drag the kayak up the beach a little and then go into town for lunch. They know the tide is still flowing out through the Heads for a few more hours so think it is safe to be away for a while. They might be unaware that at that time in this region, and despite the strong outgoing tidal current, the tide's height is in fact rising at around 40 cm/hr. This may re-float the unattended kayak and so allow it to be swept out through the Heads by the still outgoing current.
In the last half of a flooding (or inflowing) tide, the "Heads Valve" is in fact being slowly closed for inflow because the ocean level is now falling. This progressively reduces the height drop from the ocean level down to the mid-Bay level and so progressively reduces the inflow rate through the Heads.
Here we have a "Negative Water Hammer" situation where the momentum of northbound water already in the Bay removes water away from the Heads area at a faster rate than it can be replaced through the now closing "Heads Valve". The water level in the area inside the Heads therefore falls, despite the fact there is still inflow through the Heads.
By the time a previously strong inflow is actually halted to give "slack water", the water level at the Heads is typically some 30 cm BELOW that in the middle of the Bay - all thanks to the "Negative Water Hammer" effect.
Often there is confusion that the tide height can be falling in this area while water is still pouring in through the Heads. Again this is cleared up by the most generalised rule of tides: "The tide height at any location will fall if water is being removed from that area at a faster rate than it is being delivered into the area".
A situation: Consider the case of a yacht entering the Heads in the second half of a flooding tidal stream. Suppose the skipper "nudges" a reef or sandbank somewhere at or inside the Heads and becomes stuck. The skipper may "relax" rather too much, thinking that the still flooding tide will soon "lift her off". In fact very urgent action is needed to re-float the vessel because at this time, and despite the flooding tidal stream, the tide's height is then dropping at around 40 cm/hr. Any delay in getting her off will soon leave the yacht stuck fast.
Near the Heads confusion is common among recreational boaters between the vertical water movement (tide height) and the horizontal water movement (tidal stream or tidal current). To a good approximation, the tide height at such locations is largely dictated by the ocean tide height just a few km to the south. On the other hand, the tidal current at that location is largely dictated by the rate of rise (or fall) of the three hour delayed tides in the vast central, northern, and western areas of the Bay.
Since this action happens well over your horizon 30 to 50 km away, it is often forgotten about ("out of sight - out of mind"). Within 10 km of the Heads the vertical and horizontal water movements are largely independent of one another, each with its own separate cause. Mostly it will be the horizontal movement or tidal stream strength that is the more important concern for boating.
In the last half of a tidal stream at the Heads you will have either an ebbing stream but with a rising tide, or a flooding stream but with a falling tide.
Only in the first half of the tidal stream will you experience either the flooding and rising, or ebbing and falling combinations.
Note also the purists mantra that: "tides" only rise and fall and "tidal streams" only flood and ebb. Those who use just "tide" as a shorthand for either or both of these things and rely on context for the true meaning, are not really doing anyone any favours.
The graph below is derived from CSIRO's national tidal model and covers five days of tides for the Port Phillip Bay zoom insert. Extra coloured markings have been added to show the equal level and slack water times, together with the reverse level differences attained at each slack water time.

Note the significant residual current speeds of 1 to 2 knots, or 0.5 to 1.0 m/sec, at the green time lines where there is zero driving force as the blue "outside" level and the pink "inside" level plots cross over each other. Again it is also noted that the Heads current plot (black) shows it changes speed most quickly around the slack water times.
Water Volume Modelling of Port Phillip. This is a technique for determining entrance current behaviour over time by simply using the known surface areas of different parts of the Bay and the six minute tide predictions for those different parts. This allows the calculation of how the volume of water in the Bay changes throughout each tidal cycle with respect to its volume at the mean sea level height.
The difference between successive volume calculations gives the Heads inflow or outflow in terms of the change in water volume over each six minute interval. Dividing this by an estimate of the underwater cross-section between the entrance headlands yields an entrance current speed value at six minute intervals.
The first offering from this model is a plot of the Entrance Current vs the Level Difference (or "Driving Force") that powers the tidal streams at Port Phillip Heads. The plotted data in the image below are at 6 minute intervals, and cover one full flood and ebb stream cycle lasting a little over 12 hours. The 23/09/2024 date was chosen because its first flood stream begins in the first few minutes of that day. It is also a date featuring reasonably high range tides in Bass Strait.
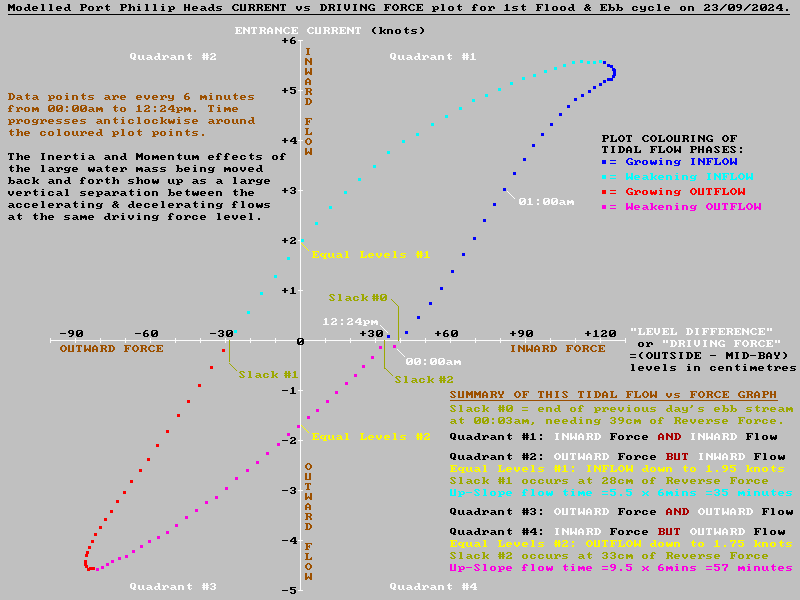
This "Flow vs Force" plot is shown with four differently coloured parts. Each colour depends on the combination of the Flow direction and whether that Flow is gaining speed or losing speed. The time stamps show the resultant graph points follow around in an anti-clockwise direction. The graphing space is also divided into four quadrants (also in anti-clockwise order). These show when the "Flow and Force" are in the same direction (Quadrants #1 & #3), or when they oppose one another (Quadrants #2 & #4).
The official line claims that the primary determinant of the current through the Heads is the difference in water levels between the "outside" and "inside" waters. However the very "open loop" nature of this plot (called hysteresis) shows that for most level difference values, there is a large difference in the current strength between when the tidal stream is gaining speed, and when it is losing speed. This difference is a reflection of the very large water inertia and momentum effects in Port Phillip as these high mass tidal streams are accelerated away from one slack water and then later are decelerated towards the next slack water.
For example in Quadrant #1, at a level difference of say +60 cm, the growing dark blue inflow has achieved a speed of a little over 1 knot. This is because much of the applied driving force is "used up" in accelerating the large water mass. This leaves only enough left to overcome the frictional flow resistance at a stream speed of just 1.3 knots.
However later on, at the same +60 cm of applied force, the decelerating water mass in the weakening tidal stream (light blue), effectively liberates an extra "change of momentum force" that adds to the applied force. This stronger force combination can overcome the much higher frictional resistance found at over 4 knots of speed. Following this curve down to the zero force level (ie. the Equal Levels point #1) shows the inward water momentum is still able to overcome the friction level at around 2 knots of speed with no applied force at all.
Data points in Quadrants #2 and #4 show the shorter up-slope flow phase. This is where the stream's residual momentum allows it to overshoot the "Equal Levels" (or "zero force") time and continue forward for a while before the growing reverse force brings it to a halt. The overshoot time in minutes can be found by counting the number of data intervals in these quadrants and multiplying by six. The reverse level difference once slack water is achieved can be read off from where the plot crosses the horizontal "zero speed axis". See the summary panel for the details.
In the example above the model's predicted slack water times are between 11 & 13 minutes earlier than those provided by the BoM. The average time difference over a full year of slacks is a little less at 3 minutes and 11 minutes respectively. It is of some comfort that two totally different modelling approaches yield slack water times for the Heads mostly within a dozen or so minutes of each other.
However testing predictions against the real slack water times in the field is difficult due to various weather effects that alter times away from the predictions in ways that are not well understood. The main weather disruptors are; wind and wave setups, the inverse barometer effect, long period coastal waves, and tidal surges from local storms.
In severe weather the tide heights and currents may differ from the predictions by up to 85 cm and 2 knots respectively. This may alter the real slack water times away from the predictions by well over an hour. Even in mild weather, differences of up to 25 cm and 0.5 knots are not unusual. These can alter the real slack water times away from the predictions by up to 30 minutes.
The only public near "real-time" source of the height difference between the measured and predicted tides in the Bay is from the Pt Richards tide gauge offshore to the northwest of Portarlington. The link to this rather large "weather & tides" image is below:
Full scale VRCA tides image (A good site, but occasionally breaks down, and more so after the merger with VPC(M). Damn - the only public site that shows tide info in near real time. I'll find out the prognosis but it looks like they might not revive this!)
Slack water times are altered most when the lower "tidal surge" curve (measured height minus predicted tide) from the Pt Richards tide gauge is changing around the same time as slack water is due. The slack water times may be approximated as roughly 10 minutes before the Pt Richards Hi/Lo times.
The weather induced height and current differences can affect the time of slack water in two ways. Firstly they can alter the time to reach the "Equal Levels" point. Secondly they can alter the extra up-slope flow time needed to build up a sufficient reverse level difference to bring the stream to a halt. Such weather effects make the in-the-field "validation testing" of slack water time predictions quite problematic.
Better testing of the predictions can be achieved by using careful field observations to measure both the up-slope flow time and the final level difference, rather than just the time of slack water. These can then be compared with their theoretical values as computed from the tidal predictions. The image below shows the result of comparing the observed values against the theoretically predicted ones for eleven on-the-water measurements during the run-up to slack water.
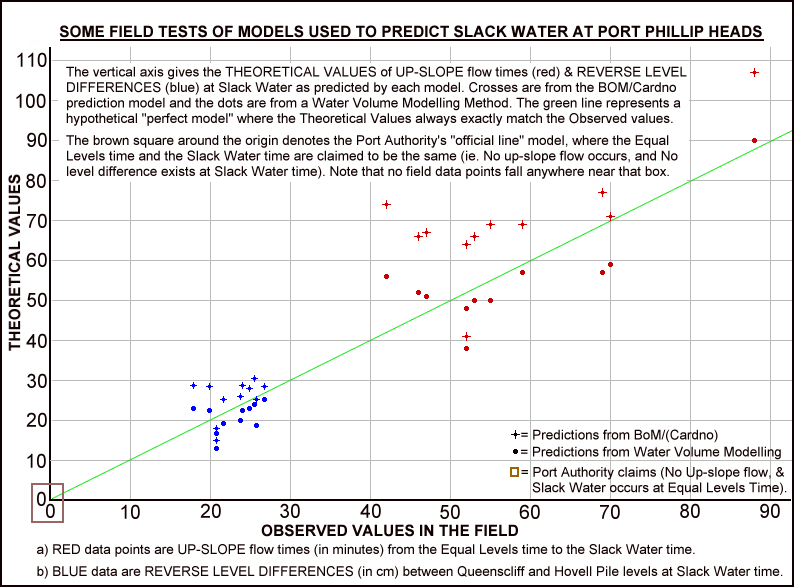
At each observed up-slope flow time, the theoretical up-slope flow times from the BoM slack predictions (red crosses) are around 10 to 15 minutes longer than the corresponding red dot times from the water volume model. The one case where the difference is small is for the only slack after flood case present in the data.
Although the data set is small, the average of the red dots underestimates the up-slope flow times, while on average the BoM red cross data overestimates them. There is other circumstantial evidence to support the suggestion that for cases of slack after ebb, the BoM slack water times may be a little late.
The blue reverse level difference data also show the BoM slack water predictions give theoretical reverse level differences (blue crosses) mostly higher than the observed values. On the other hand the water volume model tends to produce theoretical values (blue dots) mostly lower than the observed ones. The scattering on either side of the green "perfect model" line for both sets of data seems to be showing the weather effects mentioned before. Note that no data points fall anywhere near the brown square that represents the port authorities "official view" of slack water.
The variability of tides over the different lunar and solar cycles results in quite some spread in the numbers that characterise the final phase of a Port Phillip Heads tidal stream. This spread is best shown as a histogram plot for each parameter related to the arrival of a slack water event. These plots count the number of times in the year a particular parameter value occurs. The histogram plots below are from Port Phillip water volume modelling and show the distribution of count values for six slack water related parameters over all 2024 tide cycle predictions.
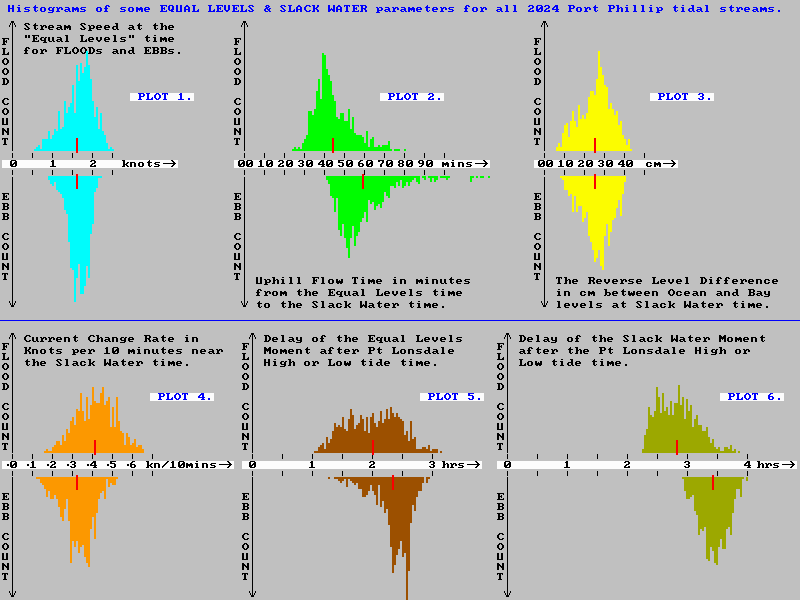
The red bars mark the average value of each parameter over a full years worth of tidal predictions. The wide distribution of these parameter values is very apparent. This is because the tide cycle sequences themselves are highly variable due to the complex and quite nuanced relative motions of the Earth, Moon, and Sun. There is really no such thing as "a typical tide", but the average values can be useful in gaining a general understanding of what usually goes on as the tidal streams reverse through Port Phillip Heads.
The "six-pack" histogram set for 2025 is presented in POST #0_C, along with a more detailed discussion of the causes of the particular histogram distributions and assymetries.
1) Build pressure for Ports Victoria to stop promoting "non-facts" in its official advice to mariners about Port Phillip Heads tidal streams. This would also resolve logical contradictions with other parts of their wording. The improved and more truthful advice will also then need to be communicated to the BoM and the Australian Hydrographic Office so their own publications can be corrected.
2) Bring to the attention of local boaters that entrance currents behave a little differently to what they may have believed. Some often made assumptions based on the official advice may actually reduce boating safety in certain situations at Port Phillip Heads.
3) To raise the importance of the quite variable "tidal stream reversing rates" at Port Phillip Heads. If predictions of these reversal rates were available alongside the usual reversal times, it could improve the safety of many who operate in this area.
4) Point out to the hardy locals, and others who cruise among the Bass Strait islands, that CSIRO's national tidal model could be a useful resource. It presents colour coded prediction maps of both tide heights (wrt MSL) and tidal current strengths. In areas where the momentum effects are strong, this hydrodynamic modelling might take a lot of the guesswork out of passage planning with tidal streams in mind. If an internet connection is a problem, the relevant map sequences can be downloaded beforehand.
5) Alert locals who don't venture much beyond the Heads that CSIRO's national tidal model is still quite a useful learning tool. During 2023 I collaborated with the CSIRO bods behind this model to successfully lobby for adding a "Port Phillip (& Western Port)" zoom insert. Other useful features were then also added to help boaters better understand the tides and streams at Port Phillip Heads. Unlike my limited data set of "maps", the CSIRO model predicts tides and streams at selected 30, 60, and 90 minute intervals over a full year for some key tidal regions around Australia.
Those wanting to play with the new PPB zoom insert recently added to this system can start with the link that follows. This lands at a "slack after flood" event in September 2024:-
PPB Levels & Currents 2024.
Or if that data is no longer available, some suitable maps in February 2025 are at this link:-
PPB Levels & Currents February 2025.
Use the controls listed below to toggle back and forth between the Height and Current maps as you step forward through a time sequence that includes several maps with the words "slack at x at . . . UTC".
[SPD/SL] = toggles the map between current SPEED and SEA LEVEL mapping modes.
[NEXT] & [PREV] = steps forward or backwards in time.
To explore other dates use:-
[DATE INDEX] = allows choice of date and approximate time (note these are UTC)
To explore other selected regions of Australia use:-
[tides] = shows a map of Australia, with the available "zoom inserts". Click one to select that region
6) Alert recreational boaters in other states that the notion of "natural water flows only run downhill" is not always correct. Where back and forth tidal motions involve large water masses, significant momentum effects will occur. This may lead to long duration up-slope flows and it can't be assumed that "slack water" occurs when no, or only a small slope, exists in the sea surface at this time.
If you arrived here by following a link from the Index Page, just close this page to return to the Index to see the other links to related posts.
If you arrived here via an external link, you can visit the site's Index Page with this link: Jake's Index Page
--------------------------------- The End ----------------------------------