A major thrust of this website is to combat the very entrenched idea that slack water at Port Phillip Heads means there is no difference in the "outside" and "inside" water levels. The main safety issue created by this widely accepted myth is that believers then tend to assume the rate at which the speed of the current changes is at a minimum around slack water whereas all the science says that the rate of speed change in the tidal current is actually close to a maximum at that time.
This result comes about because a Port Phillip tidal stream overshoots the "Equal Levels" time by a large margin and so builds up a considerable reverse level difference before it comes to a halt. It is the significant reverse level difference that creates a strong reverse force that is responsible for a completely different current vs time profile around slack water, where the current's speed changes at an almost constant rate.
Modelling results and readings from the Bay's tide gauge network both show that when strong tidal streams are halted, the average up-slope across the 15 km long "choke zone" is in the order of 3 cm/km. Nearer to the Heads it may run to nearly double at say 5 cm/km.
Although surface slopes of this order are only a tiny fraction of one degree, they still translate into a horizontal underwater pressure differential between two separated points in the same horizontal plane. In turn these horizontal pressure differences create horizontal forces that will act on the water between the two separated points.
The laws of motion allow a calculation of how that piece of water will move in such a situation. The steps in this calculation are explained with the help of the diagram below. It shows a long thin "pencil" of submerged water laying horizontally through Port Phillip Heads at slack water time after a strong flood tide has finished running in. This "water pencil" is a thousand metres long but has a square cross-section of just 1m x 1m.
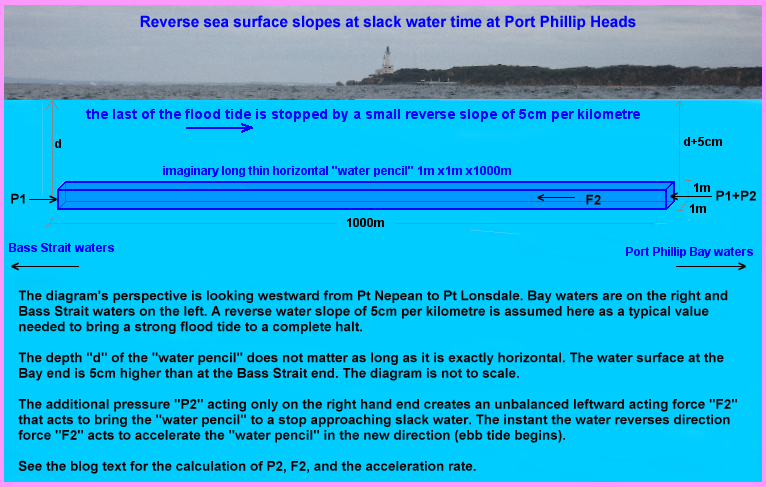
Taking the density of sea water as 1,020 Kg/m3, the total mass "m" of water within the "water pencil" will be 1020 x 1000 x 1 x 1 = 1,020,000 Kg (ie. around a million kilograms or roughly 1,000 tonnes).
The diagram's perspective is looking westward from Pt Nepean to Pt Lonsdale. Bay waters are on the right and Bass Strait waters on the left. A reverse water slope of 5 cm per kilometre is assumed here as a typical value needed to bring a strong flood tide to a complete halt. The depth "d" of the "water pencil" does not matter as long as it is exactly horizontal. The water surface at the Bay end is 5cm higher than at the Bass Strait end. The diagram is not to scale.
The absolute water pressure (or force per unit area) at any depth is due to gravity acting on the mass of both the air and the water above that point. The weight of the air alone gives us a base pressure of "one atmosphere" at the sea surface. Although this may vary a little over time with changing weather, it will be pretty much the same for all locations within 10km of each other. Scuba divers will know that dipping below the surface, the water pressure "P1" increases by an additional amount of roughly one atmosphere for every 10m of water depth.
There is an additional pressure component "P2" due to the water column at the right end of the "water pencil" being 5 cm higher. This extra height holds an additional mass of water, which for each square metre of sea surface will be:- 1020 x 1 x 1 x 0.05 = 51 Kg per square metre.
Isaac Newton's Second Law of Motion: [ F = m x a ] relates the size of an unbalanced force "F" needed on a body of mass "m" to produce a resultant acceleration of "a". Here the force "F" is in units of "Newtons" (N), mass "m" is in units of Kilograms (Kg), and the acceleration "a" is in units of meters per second per second (abbreviated as m/s/s). [ie. One Newton is defined as that force needed to accelerate a 1 Kg mass at a rate of exactly 1 m/s/s.]
Newton's study of gravitational attraction showed a similar Law: [ F = m x g ], where "g" is a constant of gravitational attraction which at the surface of the Earth has a value of 9.8 m/s/s (often termed "1g"). Thus a mass of 1 kg anywhere on the Earth's surface will experience a downward gravity force of 9.8 Newton.
The additional water pressure "P2" acting on the 1m x 1m right hand end of the "water pencil" will therefore be: 51 x 9.8 = 499.8 N/m2. This excess pressure is slightly rounded up to P2 = 500 N/m2 for simpler maths.
Water pressure acts in all directions, including on the 1m2 area of the right hand end of the "pencil", and the 1m2 lefthand end of the "pencil". However the extra pressure "P2" (= 500 N/m2) acts only on the righthand end and so produces a net leftward acting force "F2" of 500 N on the "water pencil". It is this unbalanced force that initially "pushes against the pencil" to decelerate the inflow, and then after slack water is achieved keeps "pushing the pencil" to accelerate it outwards into Bass Strait.
Roughly speaking 500 Newton is about as big a force as a human could exert (on land) in trying to shove something heavy in a sideways direction. It is a little like a man trying to to push a broken down car on a smooth level road. However in this case the "car" is rather massive at 1,020,000 Kg. On land, any such endeavour will fail due to "static friction". This is the minimum amount of force needed to generate any movement at all when solid surfaces slide over one another.
However in water there is no static friction and also since the water is almost stationary, very little frictional drag force over the seabed. Even a small applied force can start a large mass moving but the acceleration rate will be very low. A rearrangement of Newton's Law to: [ a = F / m ] allows that small acceleration rate to be calculated.
Plugging in the previously calculated leftward force (500 N) and dividing this by the mass of our one kilometre long (and 1,020,000 Kg) "water pencil" will give the pencil's leftward acceleration rate due to a 5 cm/km sea surface slope as:-
a = F / m = (500) / (1,020,000) = 0.00049 m/s/sThe waters at Port Phillip Heads can be considered as being made up of a large bundle of thousands of such horizontal "water pencils", with each one having a 500 Newton unbalanced force pushing it to the left and out into Bass Strait. The whole of the waters at the Heads will therefore be decelerating to a stop and then accelerating out into Bass Strait at the same rate of around 0.00049 m/s/s.
Note this example is for forces that exist after a strong flood tide has been stopped. Weaker tidal flows require smaller reverse level differences to stop them, lower "F2" force levels, and so will have lower deceleration and acceleration rates around slack water time.
Although the above result was obtained by working through with a particular size of horizontal "water pencil", we can easily generalize the pencil dimensions to an arbitrary "Length" and of uniform cross-sectional "Area". As before "d" represents the level difference between the two ends of the pencil, and "g" is the gravitational constant at the Earth's surface. Letting "Density" represent the density of the sea water we then have:-
Extra Force on the pencil end = F2 = ( Extra Pressure ) * Area = ( Density * d * g ) * AreaExpressed in the usual scientific units of m/s/s, the previously worked example with a 5 cm/km water slope will have the current speed changing at a rate of 0.00049 m/s/s around slack water time. This is a small number because measuring the change in speed of a very large water body over such a short time interval of one second yields this very small value. It is difficult to comprehend in a practical sense. For mariners and boating folk expressing the speed change over a longer, more sensible period of say 10 minutes, and using more everyday speed units can give us these results:-
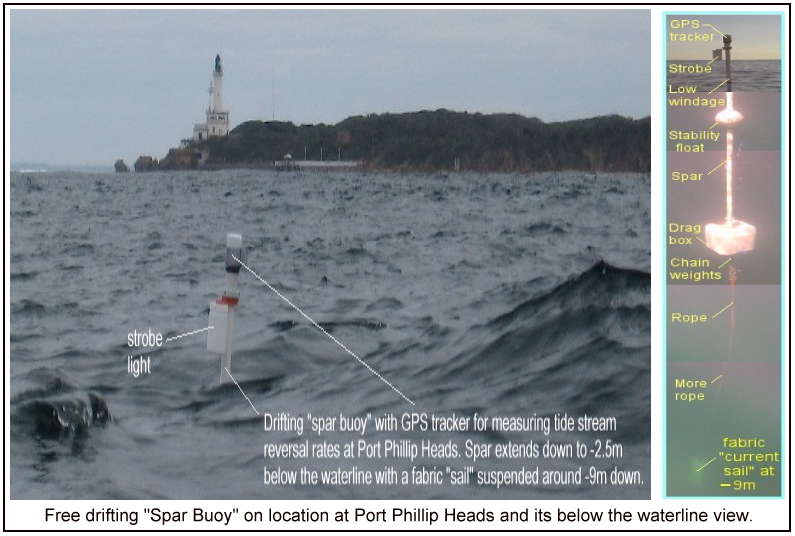
so "a" = 0.00049 x 600 = 0.294 m/s per 10 minutesOn the water it is possible to measure the rate at which the current speed changes around slack water by using a free-drifting "spar buoy". This is especially designed to have a minimum of wind resistance on its above water parts while maximizing the water's drag on parts of the buoy below the surface . The buoy also carries a GPS tracking device which allows its position (& velocity) to be measured over time as the tidal stream reverses. The results from these measurements are in good agreement with the rate of speed change around slack water calculated above for a similar tide cycle. This "spar buoy" equipment is shown below in action at Port Phillip Heads:-
Some detailed results from "spar buoy" are presented mid-way through POST #3.
In very rough terms the cross-section at the Heads is around 36,000 m2, so our bundle of thin 1m2 "water pencils" at the Heads will be around 36,000 in number. Each will have an unbalanced 500 Newton leftward force giving a total leftward force of around 18,000,000 Newton for just that 1 km long stretch of water through the Heads.
Those who support the "official line" that there is no level difference at slack water are unable to explain how this necessary high level of force to stop and reverse the stream is generated. With water friction dropping to zero at slack water, the only possible source of this force is a reverse slope in the water surface due to a significant reverse level difference between Bass Strait and the Bay's large "main body".
The previous calculations show a reverse water slope of 5 cm/km is needed near the Heads decreasing to around 1 cm/km over the Great Sands roughly 15 km away. Taking an average reverse slope of 3 cm/km over this distance gives us a reverse height difference at slack water of 45 cm. This is also in fair agreement with the slack water height difference observed in the tide gauge records of a strong tide being brought to a halt. It is the ONLY view of "Port Phillip Heads Tides and Streams" that holds any water!
***************************************************************